Total Points Range by exp3rtsThis indicator measures and displays the true intraday movement of a market by approximating tick-level activity using 1-second data aggregation. Instead of only looking at net candle movement, it sums every price change during a session, giving traders a more accurate picture of market effort and volatility.
Total Points Moved (TPM) – Captures the full distance traveled by price, not just the net gain/loss.
Bullish vs. Bearish Movement – Separates upward and downward moves so you can see who dominated the session.
Custom Sessions – Define your own session start/end times and time zone for precise tracking.
End-of-Session Summary – Automatically plots a label at session completion with totals for TPM, bullish, and bearish movement.
Visual Session Highlighting – Background shading makes it easy to see when the chosen session is active.
This tool is useful for:
Understanding the true effort vs. result of price movement
Comparing volatility across sessions
Identifying whether bulls or bears contributed more to market swings
Supporting order flow and tick-based trading strategies
In den Scripts nach "session high" suchen

Opening Range TraderThis indicator, "Opening Range Trader," provides visual tools for defining and tracking two customizable intraday ranges plus today’s open, high, and low. It is designed for day traders to identify support, resistance, and breakout opportunities by automatically marking key price levels that often shape the day's momentum.
It offers:
Customizable start and end times for two independent time ranges.
Toggle options to display lines for the selected ranges and for today’s open, high, and low.
Automatic adaptation for New York market hours.
Real-time updates for session highs/lows and today’s evolving levels.
Traders use this to watch for breakouts above or below the opening range (ORB strategy), to fade false moves when price returns inside the range, or to participate in trending moves after volatility begins. A common setup is entering long on closes above the range high, or short on closes below the range low, with stops and targets based on the range’s width or the opposite boundary.
Risk management approaches include placing stop losses at the midpoint or at the opposite end of the range, and adjusting targets for measured moves. Volume confirmation can help filter valid breakouts, while adapting times for specific assets and trading styles maximizes flexibility.
The second range allows traders to repeat similar strategies later in the session for evolving momentum windows, making this indicator useful for multiple intraday setups.

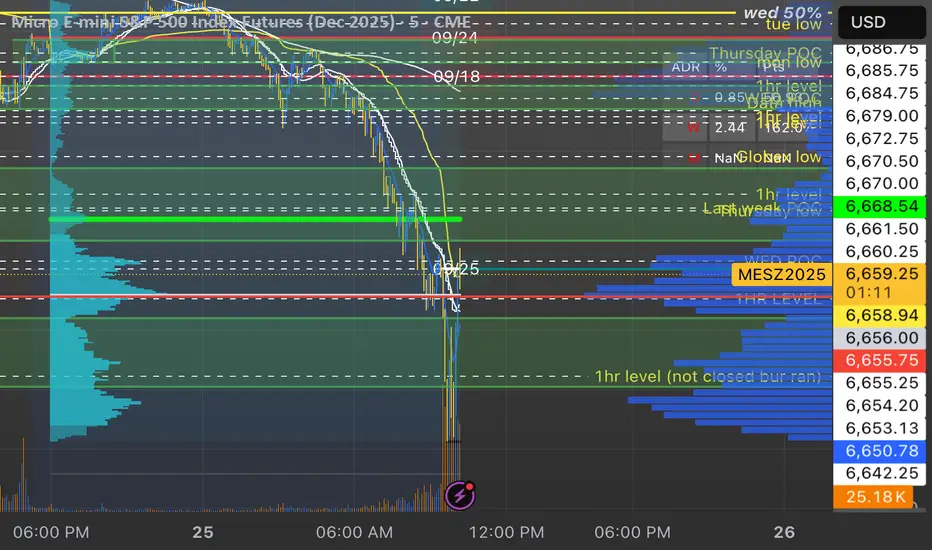
Multi EMA and Key Levels IndicatorKey Features:
Daily and Previous Day Levels
Plots today’s high and low.
Plots the previous day’s high (Y HOD) and low (Y LOD), with labels anchored to the price axis.
Premarket (Globex) High and Low
Tracks premarket session highs and lows (defined as 5:00 PM to 8:30 AM Chicago time).
Updates dynamically during the session and plots “GLOBEX HIGH” and “GLOBEX LOW” lines with labels.
Exponential & Simple Moving Averages
User can select 3 EMAs (default 8, 21, 200).
Plots EMAs with distinct colors.
Plots the 200-day SMA for longer-term trend context.

RTH_Open_Futures_RWARTH NY Open — Session Anchor & Levels (Futures-aware)
What it does:
Anchors your intraday view to the New York RTH open (09:30 ET) and draws the core decision levels for U.S. stocks and CME equity-index futures. In Futures mode, it respects the CME RTH close at 16:15 ET (vs. 16:00 ET for cash equities).
Plots (toggle on/off):
RTH Open line from 09:30 ET to session end (label optional).
RTH Close at 16:15 ET in Futures mode (16:00 in Cash mode).
Session High/Low with optional midpoint and range fill.
Prior-day close + gap label/box at the open; optional “gap filled” color change.
Initial Balance (09:30–10:30) with optional extensions.
RTH-only VWAP with optional bands.
Session start/end markers and end-of-day range label.
Behavior & reliability:
Correct session windows: Futures 09:30–16:15 ET, Cash 09:30–16:00 ET.
Precise handling of the last RTH bar (no drift, no repaint).
DST-safe and multi-timeframe friendly (1–5m ideal; higher TFs supported).
Inputs:
Market Mode: Futures vs. Cash.
Per-element show/hide, line style/weight, label formatting.
Alerts: Touch/Break (Open, H/L, IB, VWAP), Gap Fill, New Session.
Use it for:
Fast bias framing around the open (reclaim/loss).
Gap management (targets/risk).
Range development via H/L and midpoint.
IB structure and clean RTH VWAP without Globex noise.
Notes:
PT equivalents: Futures 06:30–13:15 PT, Cash 06:30–13:00 PT.
Designed for standard U.S. RTH; extended hours intentionally excluded.
TL;DR:
A clean, futures-aware RTH scaffold: open, close, prior close, gap, IB, VWAP, and session H/L—precise, minimal, and alert-ready.
Forex Session HighlighterSet the session start and stop time for one single session. Allows a trader to easily see their preferred trading times at a glance. Especially helpful during bar replay.

VWAP Confluência 3x VWAP Confluence 3x — Daily · Weekly · Anchored
Purpose
A pragmatic VWAP suite for execution and risk management. It plots three institutional reference lines: Daily VWAP, Weekly VWAP, and an Anchored VWAP (AVWAP) starting from a user-defined event (news, earnings, session open, swing high/low).
Why it matters
VWAP is the market’s “fair price” weighted by where volume actually traded. Confluence across timeframes and events turns noisy charts into actionable bias and clean levels.
What it does
Daily VWAP — resets each trading day; intraday “fair value.”
Weekly VWAP — resets each week; swing context and larger player defense.
Anchored VWAP — starts at a precise timestamp you set (e.g., news release).
Price source toggle — Typical Price
(
𝐻
+
𝐿
+
𝐶
)
/
3
(H+L+C)/3 or Close.
Visibility switches — enable/disable each line independently.
Anchor marker — labels the first bar of the AVWAP.
Inputs
Show Daily VWAP (on/off)
Show Weekly VWAP (on/off)
Show Anchored VWAP (on/off)
Price Source: Typical (H+L+C)/3 or Close
Anchor Time: timestamp of your event (uses the chart/exchange timezone)
How to anchor to a news event
Find the exact release time as shown in your chart’s timezone.
Open the indicator settings → set Anchor Time to that minute.
The AVWAP begins at that bar and accumulates forward.
Playbook (examples, not signals)
Strong long bias: price above Daily and Weekly VWAP; AVWAP reclaimed after news.
Strong short bias: price below Daily and Weekly; AVWAP reject after news.
Mean-revert zones: price stretches far from the active VWAPs and snaps back; size around VWAP with tight risk.
Targets: opposite VWAP, prior day/week highs/lows, or liquidity pools near AVWAP.
Best used with
Session highs/lows, liquidity sweeps, volume profile, and time-of-day filters.
Notes & limitations
Works best on markets with reliable volume (equities, futures, liquid crypto). FX spot uses synthetic volume—interpret accordingly.
Anchor Time respects the chart’s timezone. Convert news times before setting.
This is an indicator, not a backtestable strategy. No trade advice.
Disclaimer
For educational purposes only. Trading involves risk. Do your own research and manage risk responsibly.

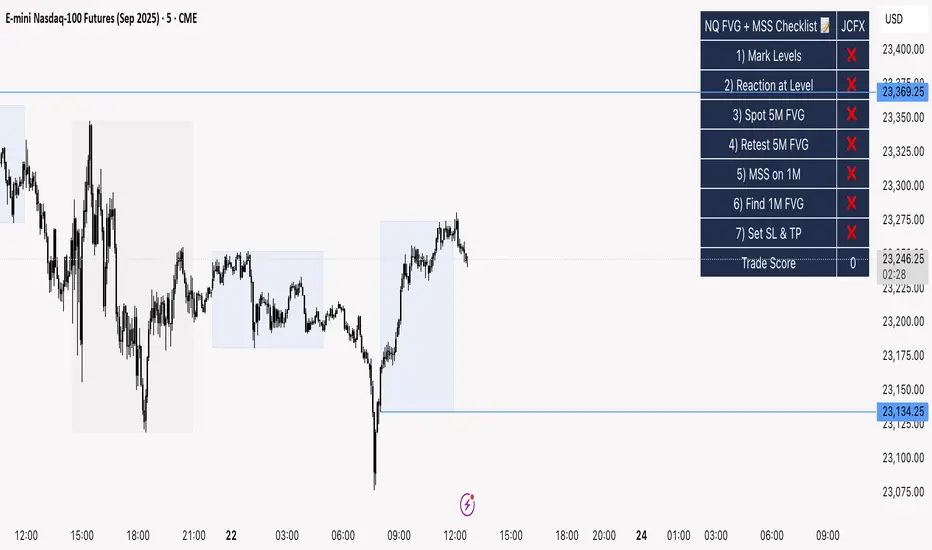
NQ FVG + MSS ChecklistThe NQ FVG + MSS Quick Checklist is a simple yet powerful visual tool for traders focusing on the Nasdaq 100 (NQ) futures. It provides a step-by-step checklist to assess trade setups based on key market concepts like Fair Value Gaps (FVG), Market Structure Shifts (MSS), session highs/lows, and previous day levels.
This indicator helps you quickly see which elements of your trading plan are met before entering a trade. Each checklist item can be manually toggled, and a cumulative Trade Score provides a quick visual guide to setup strength.
Key Features:
Step-by-step checklist for NQ trading setups
Track levels: Session highs/lows & Previous Day High/Low
Spot 5M FVG and Retests
Identify MSS on 1M and find 1M FVG inside MSS
Manual SL & TP guidance
Trade Score for quick setup strength assessment
Fully visible table overlay on top of the chart
How to Use:
Mark session & previous day levels
Observe reaction at key levels (Sweep or Continue)
Identify 5M FVG and any retests
Spot 1M MSS and 1M FVG inside MSS
Set SL/TP based on FVG extremes and next session levels
Check the cumulative Trade Score for setup confirmation
Note: This indicator is manual input-based, letting traders tick off items as they analyze the chart, making it a lightweight trading checklist HUD that stays on top of all chart elements.
Breakout asia USD/CHF1 — Customizable Parameters
sess1 & sess2: The two time ranges that define the Asian session (e.g., 20:00–23:59 and 00:00–08:00).
Important: format is HHMM-HHMM.
rr: The risk/reward ratio (default = 3.0, meaning TP = 3× risk size).
onePerSess: Toggle to allow only one trade per Asian session or multiple.
bufTicks: Extra margin for the SL beyond the signal candle.
2 — Detecting the Asian Session
The script checks if the candle’s time is inside the first range (sess1) or inside the second range (sess2).
While inside the Asian session, it updates the current high and low.
When the session ends, it locks in these levels as rangeHigh and rangeLow.
3 — Step 1: Detecting the Initial Breakout
Bullish breakout → close above rangeHigh → flag breakoutUp is set to true.
Bearish breakout → close below rangeLow → flag breakoutDown is set to true.
No trade yet — this is just the breakout signal.
4 — Step 2: Waiting for the Retest
If a bullish breakout occurred, wait for the price to return to or slightly below rangeHigh and then close back above it.
If a bearish breakout occurred, wait for the price to return to or slightly above rangeLow and then close back below it.
5 — Entry & Exit
When the retest is confirmed:
strategy.entry() is triggered.
SL = behind the retest confirmation candle (with optional bufTicks margin).
TP = entry price ± RR × risk size.
If onePerSess is enabled, no further trades happen until the next Asian session.
6 — Chart Display
Green line = locked Asian session high.
Red line = locked Asian session low.
Light blue background = active Asian session hours.
Trade entries are shown on the chart when retests occur.

Chiefs sessions 4.1This indicator marks out the most recent asian session and London sessions highs and lows. It also marks off the previous days candles highs and lows in white. Asian session is blue and London is red. This indicator resets every day.
Chiefs sessions 4This is just an indicator marking the most recent asian session and london session highs and lows, and also marks off previous days high and lows in white. Blue is asian session and red is london. This indicator resets every day.

ORB Scalp setup on 15min by UnenbatThis indicator draws a 2-minute Opening Range Box (ORB) at the beginning of each 15-minute candle by combining the last minute of the previous candle and the first minute of the current one. It highlights the session high/low during this range, and extends the box for a customizable duration. TP and BE lines are also plotted above/below the range for strategic planning. Perfect for scalpers using 15-minute timeframe.

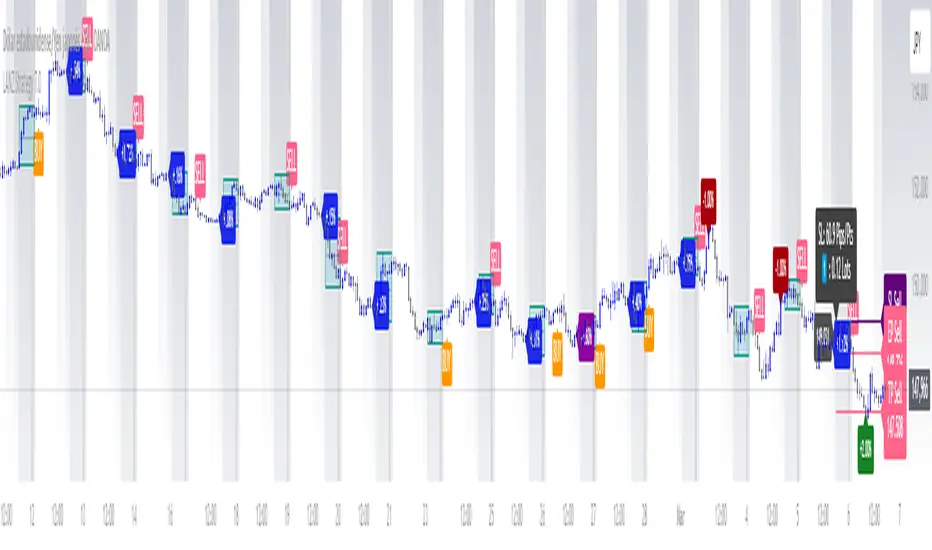
LANZ Strategy 7.0🔷 LANZ Strategy 7.0 — Multi-Session Breakout Logic with Midnight-Cross Support, Dynamic SL/TP, Multi-Account Lot Sizing & Real-Time Visual Tracking
LANZ Strategy 7.0 is a robust, visually-driven trading indicator designed to capture high-probability breakouts from a customizable market session.
It includes full support for sessions that cross midnight, dynamic calculation of Entry Price (EP), Stop Loss (SL) and Take Profit (TP) levels, and a multi-account lot sizing panel for precise risk management.
The system is built to only trigger one trade per day and manages the full trade lifecycle with automated visual cleanup and detailed alerts.
📌 This is an indicator, not a strategy — it does not place trades automatically, but provides exact entry setups, SL/TP levels, risk-based lot size guidance, and real-time alerts for execution.
🧠 Core Logic & Features
🚀 Entry Signal (BUY/SELL)
The trading day begins with a Decision Session (yellow box) where the high/low range is recorded.
Once the Operative Session starts (blue zone), the first touch of the session’s high triggers a BUY setup, and the first touch of the session’s low triggers a SELL setup.
Only one valid trade can be triggered per day — the system locks after the first signal.
⚙️ Dynamic Stop Loss & Take Profit
SL levels are derived from the Decision Session high/low using customizable Fibonacci multipliers (independent for BUY and SELL).
TP is dynamically calculated from the EP–SL distance using a user-defined Risk:Reward ratio (R:R).
All EP, SL, and TP levels are drawn as independent lines with customizable colors, label text size, and style.
⏳ Session & Midnight-Cross Support
Works with any custom Decision/Operative session hours, including sessions that start one day and end the next.
Properly tracks time zones using New York session time for consistency.
Includes Cutoff Time: after this limit, no new entries are allowed, and all visuals are auto-cleared if no trade was triggered.
💰 Multi-Account Risk-Based Lot Sizing
Supports up to 5 independent accounts.
Each account can have:
Own capital
Own risk percentage per trade
Lot size is auto-calculated based on:
SL distance (in pips or points)
Pip value (auto-detected for Forex or manually set for indices/commodities)
Results are displayed in a clean lot size info panel.
🖼️ Real-Time Visual Tracking
Dynamic updates to all levels during the Decision Session.
EP, SL, TP lines update if the session high/low changes before the Operative Session starts.
Trade result labels:
SL hit → “–1.00%” in red
TP hit → “+X.XX%” in green
Manual close at Operative End → shows actual % result in blue or purple.
🔔 Alerts for Every Key Event
Session start notification
EP entry triggered
SL or TP hit
Manual close at session end
Missed entry due to cutoff
🧭 Execution Flow
Decision Session (Yellow) — Capture high/low range.
Operative Session (Blue) — First touch of high = BUY setup; first touch of low = SELL setup.
Plot EP, SL, TP lines + calculate lot sizes for all active accounts.
Track trade until SL, TP, or Operative End.
If no entry triggered by Cutoff Time → clean all visuals and notify.
💡 Ideal For:
Traders who operate breakout logic on specific sessions (NY, London, Asian, or custom).
Those managing multiple accounts with strict risk per trade.
Anyone trading assets with sessions crossing midnight.
👨💻 Credits:
Developer: LANZ
Logic Design: LANZ
Built For: Multi-timeframe session breakouts with high precision.
Purpose: One-shot trade per day, risk consistency, and total visual clarity.
PipsHunters Trading ChecklistTitle: PipsHunters Trading Checklist (PHTC)
Short Description / Teaser:
Enforce trading discipline and never miss a step in your pre-trade analysis with this simple, interactive, on-chart checklist.
Full Description:
🚀 Overview
The PipsHunters Trading Checklist (PHTC) is a powerful yet simple tool designed to instill discipline and structure into your trading routine. In the heat of the moment, it's easy to forget crucial steps of your analysis, leading to impulsive and low-probability trades. This indicator acts as your personal co-pilot, providing a persistent, on-chart checklist that you must manually complete before taking a trade.
This is not an automated signal generator. It is a utility to keep you accountable to your own trading plan. The checklist items are inspired by common concepts in price action and Smart Money Concepts (SMC) methodologies, but they serve any trader who follows a rule-based system.
✨ Key Features
Interactive On-Chart Table: Displays a clean, non-intrusive table directly on your chart.
Manual Check-off System: You are in full control. Go into the indicator settings and check off each item as you complete your analysis.
Real-Time Progress Tracking: The table header shows your progress (e.g., 4/7) and changes color from red to green when all items are checked.
Clear Visual Cues: Each item is marked with a ✅ or ❌, and the text color changes to provide an at-a-glance status.
"Ready!" Status: A final "READY!" confirmation appears once your entire checklist is complete, giving you the green light to look for an entry based on your strategy.
Fully Customizable Position: Place the table in any corner of your chart (Top Left, Top Right, Bottom Left, Bottom Right) to suit your layout.
📋 The Checklist Items Explained
The default checklist guides you through a structured, top-down analysis process common in many trading strategies:
Seat before 1H: A reminder to be settled and mentally prepared at your desk at least an hour before your target session begins. Avoids rushing and emotional decisions.
Check News: Have you checked for high-impact news events that could introduce extreme volatility and invalidate your setup?
Mark Day Open: The daily open is a key institutional level. Marking it helps establish the daily bias.
Mark LQ Levels: Have you identified key Liquidity (LQ) levels? This includes previous day/week highs and lows, session highs/lows, and other obvious swing points.
Wait for Kill Zone: A reminder to be patient and wait for price to trade into a specific, high-probability time window (e.g., London Kill Zone, New York Kill Zone).
LQ sweep inside Kill Zone: The core of the setup. Has price swept a key liquidity level within your chosen Kill Zone?
Lower TF Confirmations: After the liquidity sweep, have you waited for confirmation on a lower timeframe? This is often a Market Structure Shift (MSS) or Change of Character (CHoCH).
🛠️ How to Use
Add the "PipsHunters Trading Checklist" indicator to your chart.
Go to the indicator's Settings (click the gear icon ⚙️).
As you perform each step of your pre-trade analysis, tick the corresponding checkbox in the Inputs tab.
The on-chart table will update instantly to reflect your progress.
Only when all 7 items are checked will the table signal "READY!".
🎯 Who Is This For?
This indicator is perfect for:
SMC / ICT Traders: The checklist items align directly with Smart Money Concepts.
New Traders: Helps build the essential habit of a consistent pre-trade routine.
Inconsistent Traders: Acts as a guardrail to prevent impulsive, undisciplined entries.
Any Rule-Based Trader: Anyone who follows a trading plan can benefit from the structure it provides.
Disclaimer: This is a utility tool to aid in discipline and execution. It does not provide financial advice or guarantee profitable trades. All trading involves risk, and you are solely responsible for your own decisions. Trade safe and stay disciplined!

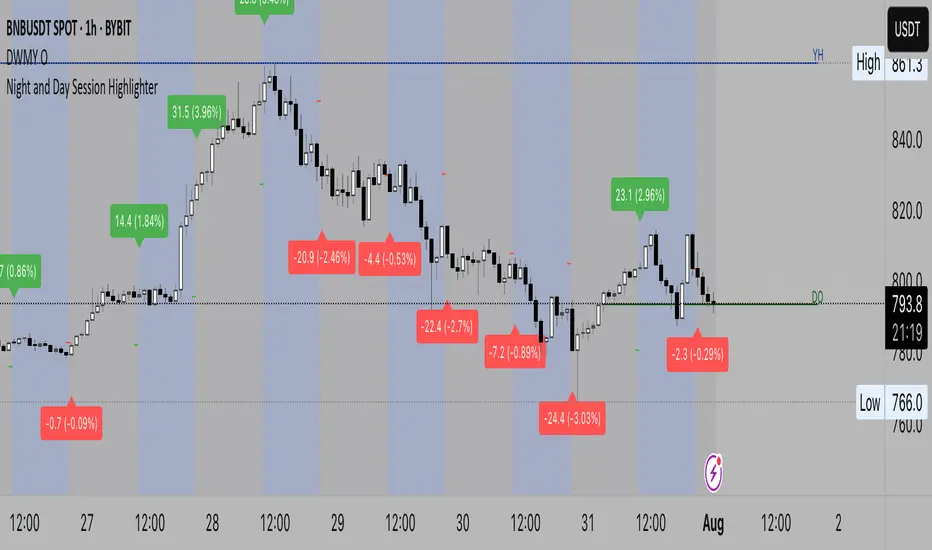
Night and Day Session Highlighter % (Valehson)- This script splits the day into night and day sessions and displays the price change in percentage.
- Этот скрипт разделяет день на вечерние и дневные сессии и показывает изменение цены в процентах.
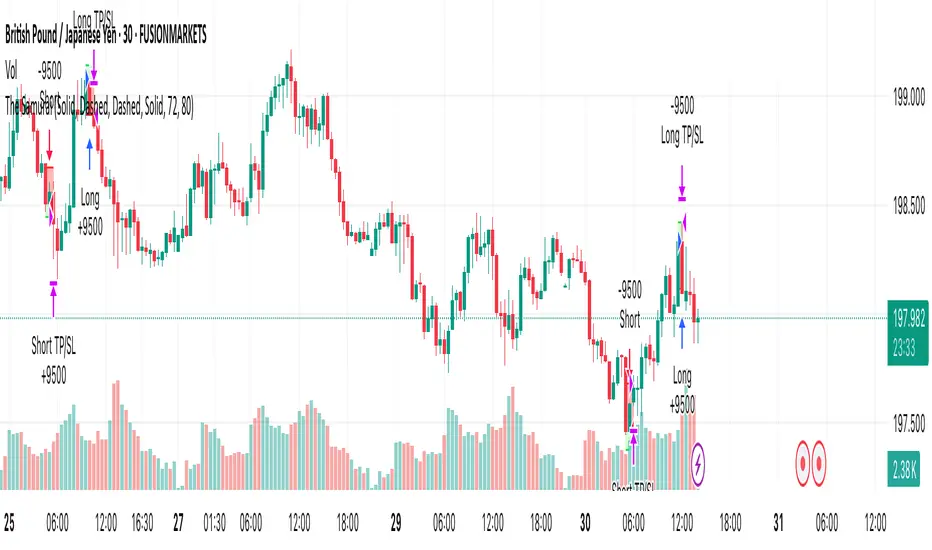
The SamuraiOverview
This strategy implements a session-based range breakout system specifically designed for GBP/JPY trading. The approach focuses on identifying key price ranges during specific market sessions and trading breakouts of these ranges during optimal trading windows. The strategy combines multi-timeframe analysis using 30-minute data with precise session timing to capture high-probability breakout moves.
Entry Logic
The strategy operates on a two-phase approach:
Range Collection Phase:
Monitors price action during a specified session window
Identifies session high and low levels
Only collects ranges on selected trading days
Trading Phase:
Long Entry: Price closes above the established session high
Short Entry: Price closes below the established session low
Entries only occur on valid trading days (day after range collection)
One trade per direction per session to prevent overtrading
Exit Conditions
Stop Loss: Set at a percentage of the session range below entry (long) or above entry (short)
Take Profit: Calculated using a Risk-Reward Ratio based on stop loss distance
Session Close: All positions are closed at the end of the trading window
Risk Management Features
Fixed risk-reward ratio of for consistent risk management
Stop loss calculated as percentage of session range for adaptive sizing
Visual risk/reward boxes display potential outcomes before entry
Daily session close protection prevents overnight exposure
Visual Features
Customizable Colors: Full control over line colors, styles, and box opacities
Risk/Reward Visualization: Color-coded boxes showing potential profit and loss zones
Take Profit Lines: TP level with different line styles for clarity
Stop Loss Line: Clear visual indication of risk level
Clean Interface: Streamlined settings focused on essential visual customization
Important Notes
Timeframe Dependency: Strategy uses 30-minute data regardless of chart timeframe for consistency
Session Timing: All times are in UTC - ensure proper timezone conversion for your location
Trading Days: Default setup trades Tuesday-Friday ranges (Monday-Thursday collection)
Single Position: Only one position per direction per session to maintain discipline
No Pyramiding: Strategy prevents position averaging to maintain clear risk parameters
Suggested Use
Recommended Pairs: Optimized for GBP/JPY but may work on other volatile pairs
Best Timeframes: Display on any timeframe (strategy uses 30m data internally)
Session Awareness: Most effective during high-volatility session transitions
Risk Management: Consider position sizing based on account risk tolerance
Market Conditions: Performs best in trending or breakout market environments
Backtesting Considerations
Strategy includes realistic entry/exit conditions based on closing prices
Visual elements help understand historical performance context
Built-in position management prevents unrealistic results
Session-based logic ensures trades align with actual market sessions
This strategy is designed for traders who prefer systematic, rule-based approaches to breakout trading with clear risk management parameters. The visual feedback helps in understanding market context and decision-making process.
Disclaimer: Past performance does not guarantee future results. Always test thoroughly on historical data and consider your risk tolerance before live trading.
Stockraft HFT Candles⚡ HFT Candle Indicator
🧠 What Are HFT Candles?
HFT (High-Frequency Trading) candles are sharp, fast price movements often created by large algorithmic orders. These candles typically:
Break key highs/lows or liquidity zones
Quickly reverse, trapping retail traders on the wrong side
Signal manipulation or smart money activity
✅ How to Use the Indicator
Spot Liquidity Sweeps
When a candle pierces above recent highs or below recent lows and gets marked by this indicator, it's likely an HFT candle.
These candles usually act as liquidity grabs — not genuine breakouts.
Wait for Rejection or Confirmation
Do not enter immediately.
Wait for the next candle to show rejection (e.g., pin bar, engulfing) or close back within the previous range.
Trade in the Opposite Direction
HFT candles often trap traders chasing breakouts.
Look to trade in the opposite direction of the HFT candle after confirmation.
Example: If the candle breaks a high and reverses → look for a short.
If it breaks a low and reverses → look for a long.
Best Used With Zones
Works best near:
Support/Resistance
Supply/Demand Zones
Session Highs/Lows
News-induced spikes
🎯 Purpose
This indicator helps you:
Avoid false breakouts
Understand smart money behavior
Time entries around liquidity grabs
Increase win-rate by trading reversals after traps

Liquidity Grab Detector (Stop Hunt Sniper) v2.2📌 Purpose
This indicator detects Stop Hunts (Liquidity Grabs) — false breakouts above/below recent highs or lows — filtered by trend direction, volatility, and volume conditions.
It is designed for scalpers and intraday traders who want to identify high-probability reversal zones.
🧠 How It Works
1. Key Logic
Detects previous swing high / swing low over the Lookback Bars.
Marks a false breakout when price moves beyond the level and closes back inside.
Requires a volume spike on the breakout to confirm liquidity sweep.
2. Trend Filter (EMA 50)
Bullish signals only if price is above EMA 50.
Bearish signals only if price is below EMA 50.
This removes most counter-trend stop hunts.
3. ADX Filter
Signals appear only when ADX < Max ADX (low-trend conditions).
This avoids false signals in strong trending markets.
📈 How to Use
Green Arrows: Bullish stop hunt (potential long entry).
Red Arrows: Bearish stop hunt (potential short entry).
Works best in range conditions, liquidity zones, or near session highs/lows.
Combine with order flow, volume profile, or price action for extra confirmation.
Recommended Timeframes: 1m–15m for scalping; 30m–1h for intraday.
Markets: Crypto, Forex, Indices.
⚙️ Inputs
Lookback Bars — swing detection
Volume Spike Multiplier
EMA Length (trend filter)
Min Retrace — how much price must return inside range
Max ADX — trend filter sensitivity
⚠️ Disclaimer
This script is for educational purposes only and does not constitute financial advice.
Always test thoroughly before live trading.

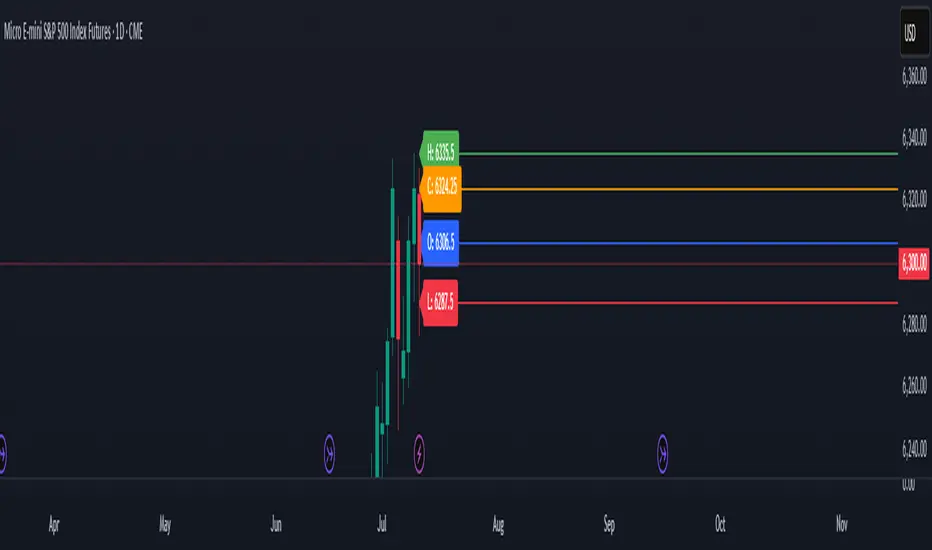
Previous Day OHLC# Previous Day OHLC Levels Indicator
## Overview
The Previous Day OHLC indicator is a simple yet powerful tool that plots the Open, High, Low, and Close levels from previous trading sessions. This indicator helps traders identify key support and resistance levels based on historical price action, making it easier to spot potential reversal zones and breakout levels.
## Key Features
### 📊 **Previous Day OHLC Levels**
- Displays the Open, High, Low, and Close prices from 1-5 days ago
- Lines automatically extend to the right for easy visualization
- Updates daily to show the most relevant levels
### 🎨 **Fully Customizable Styling**
- **Individual Line Colors**: Choose unique colors for each OHLC level
- **Line Styles**: Select from Solid, Dashed, or Dotted lines for each level
- **Line Width**: Adjust thickness from 1-4 pixels for better visibility
- **Price Labels**: Display actual price values on each line with customizable sizing
### ⚙️ **Flexible Settings**
- **Lookback Period**: Choose to display levels from 1-5 days ago (maximum safety limit)
- **Label Control**: Toggle price labels on/off and adjust their size
- **Performance Optimized**: Clean code that won't slow down your charts
## How to Use
1. **Add to Chart**: Apply the indicator to any timeframe chart
2. **Customize Settings**: Adjust colors, styles, and lookback period to your preference
3. **Identify Levels**: Use the plotted lines as potential support/resistance zones
4. **Trade Setup**: Look for price reactions at these key levels for entry/exit signals
## Best Practices
- **Day Trading**: Use 1-day lookback for intraday support/resistance
- **Swing Trading**: Extend lookback to 2-5 days for broader context
- **Multi-Timeframe**: Combine with other timeframe analysis for confirmation
- **Risk Management**: Use these levels for stop-loss and take-profit placement
## Color Coding (Default)
- **Open**: Blue - Starting price of the previous session
- **High**: Green - Highest price reached
- **Low**: Red - Lowest price reached
- **Close**: Orange - Final price of the session
## Why This Indicator Works
Previous day OHLC levels are among the most watched price points by professional traders. These levels often act as:
- **Support/Resistance**: Price tends to react at these historical levels
- **Breakout Confirmation**: Strong moves beyond these levels can signal trend continuation
- **Reversal Zones**: Price often bounces from these key levels
- **Psychological Levels**: Market participants remember these important price points
## Technical Specifications
- **Pine Script Version**: v6
- **Overlay**: Yes (plots directly on price chart)
- **Performance**: Optimized for smooth chart operation
- **Compatibility**: Works on all timeframes and instruments
Perfect for traders of all experience levels who want to incorporate previous day levels into their technical analysis toolkit!
Next Day Key Levels [Auto-Pivot Suite] RobustNext Day Key Levels
Automatically plot key levels (Floor Pivots) for the next U.S. trading day, with smart session detection.
What does this script do?
Automatically detects the most recent completed U.S. regular trading session (9:30 AM–4:00 PM Eastern) and plots all classic Floor Pivot levels for the next trading day.
Handles Mondays and holidays: Always uses the most recent session’s data, so Friday’s values are shown on Monday, and holidays are skipped seamlessly.
Works in both pre-market and after-hours—levels appear for the next session at the right time.
Levels plotted:
Previous Session High (H)
Previous Session Low (L)
Previous Session Close (C)
Pivot (P)
Resistance 1, 2, 3 (R1, R2, R3)
Support 1, 2, 3 (S1, S2, S3)
How it works
Monitors each bar and tracks session highs/lows/close only during regular market hours.
At the close of each session (4:00 PM ET), saves these values.
In pre-market (before 9:30 AM ET) and after-hours (after 4:00 PM ET), automatically plots levels based on the last completed session—always the correct session, even on Mondays and after holidays.
Why is it better?
No clutter: Only one set of levels per day, drawn cleanly.
Accurate pivots for every next U.S. session.
Zero manual setup: Add to any U.S. ticker, on any intraday timeframe.
Features
Works across all U.S. stocks and ETFs.
Plots and labels all levels with color coding for quick reference.
Designed for intraday and short-term trading strategies.
Handles time zone and market session edge cases automatically.
How to use
Add the indicator to any U.S. equity or ETF chart (15m–1h timeframes recommended).
Levels will appear automatically in pre-market or after the market closes, always for the next session.
Trade with confidence using automatic, accurate pivots and support/resistance levels.
Developed by .
For questions or feedback, leave a comment below!

Previous Highs & Lows (Customizable)Previous Highs & Lows (Customizable)
This Pine Script indicator displays horizontal lines and labels for high, low, and midpoint levels across multiple timeframes. The indicator plots levels from the following periods:
Today's session high, low, and midpoint
Yesterday's high, low, and midpoint
Current week's high, low, and midpoint
Last week's high, low, and midpoint
Last month's high, low, and midpoint
Last quarter's high, low, and midpoint
Last year's high, low, and midpoint
Features
Individual Controls: Each timeframe has separate toggles for showing/hiding high/low levels and midpoint levels.
Custom Colors: Independent color selection for lines and labels for each timeframe group.
Display Options:
Adjustable line width (1-5 pixels)
Variable label text size (tiny, small, normal, large, huge)
Configurable label offset positioning
Organization: Settings are grouped by timeframe in a logical sequence from most recent (today) to least recent (last year).
Display Logic: Lines span the current trading day only. Labels are positioned to the right of the price action. The indicator automatically removes previous drawings to prevent chart clutter.

Auto FaustAuto Faust – Intraday Market Context & Structure
Auto Faust is a visual market overlay designed for intraday traders who want fast context without relying on signals or automation. It combines classic price tools — VWAP, EMAs, RSI, Chop Score, and market structure trendlines — into a single glanceable dashboard.
🔍 What It Does:
VWAP (Volume Weighted Average Price): Shows the day's fair value price anchor.
EMAs (3, 21, 113, 200): Map short-term to long-term trend alignment. Crossovers can be used for confluence or caution.
RSI (10): Monitors local momentum. Displayed in a compact table.
Chop Score: Measures how directional price action is. High chop = ranging conditions; low = trending.
Session High/Low Tracker: Tracks the daily extremes in real-time.
Volume Monitor: Shows current candle volume, color-coded vs previous bar (green = higher, red = lower).
Dynamic Support & Resistance Lines: Plotted from pivot highs/lows (not static levels).
Automatic Trendlines: Drawn from swing structure, updating live.
📊 How to Use:
Use EMAs + VWAP alignment to assess directional bias.
Confirm clean trends with low Chop Score and RSI support.
Watch for price interaction around dynamic S/R lines and trendline breaks.
Use volume coloring to assess if momentum is increasing or fading.
No buy/sell signals are generated — this is a trader-facing tool to guide discretionary decision-making.

SwingArm ATR Trend (Blackflag FTS) + HTF Zones & Trail📐 SwingArm ATR Trend + HTF Zones | Blackflag FTS Concept
A precision-engineered volatility mapping and trend-trailing system inspired by the Blackflag FTS / SwingArm ATR methodology — now enhanced with multi-timeframe confluence, adaptive ATR zones, and Fibonacci-level support/resistance architecture.
Designed for trend traders, scalpers, and swing specialists, this tool visually defines where price is likely to pivot, trend, or exhaust — based entirely on structure and volatility, not lagging signals.
🧩 Core Logic
🔹 Adaptive Swing Zones (Current TF)
Built using Fibonacci-scaled ATR offsets from a dynamic midline (the average of the session high/low), these zones evolve with price structure:
Zone +1 / -1: Primary volatility boundaries — breakout or pullback zones.
Zone +2 / -2: Extended moves — high-momentum areas.
Zone +3 / -3: Exhaustion zones — potential reversal or take-profit areas.
Color shifts dynamically based on directional bias (bullish/bearish).
🟨 Trailing Stop (Current TF)
An adaptive trailing stopline that follows trend shifts using midline ± ATR logic.
Acts as a bias filter and exit manager.
Color-coded for clarity.
Flips based on price’s relationship to the trail.
🔶 Higher Timeframe Zones (HTF Overlay)
Optional overlay that mirrors the full structure — zones + trailing stop — from a higher timeframe of your choice.
Perfect for:
Validating local moves against macro context.
Spotting higher-timeframe traps or confluence breakouts.
🛠️ Settings & Customization
ATR Period — default is 14, but adaptable to asset volatility.
Source — usually close, but adjustable for experimentation.
Show/Hide Toggles — independently control visibility for:
Current TF zones & trail
HTF overlay
Zone Colors — full control for bullish/bearish bias on both timeframes.
Line Widths — customize to fit any chart style or background.
🎯 Real-World Trade Examples
📈 Long Trend + Pullback
Price breaks through Zone +1 with momentum.
Trail flips bullish; price holds above it.
HTF trail and zones are also bullish.
Entry: On retracement to the trail or Zone +1.
Exit: At Zone +2 or a trail break.
📉 Short Reversal
Price rejects Zone +2 with bearish candle.
Trail flips to bearish shortly after.
HTF trail confirms downtrend.
Entry: On retest of Zone +1 or failed bounce at trail.
Exit: At Zone -1/-2 or upon trail break.
🔁 Range or Fade Play
In low-trend conditions, Zones +2/-2 act as mean-reversion pivot points.
Scalp entries can be taken with tight stops near those extremes.
Avoid during clear HTF directional bias.
🧠 Trading Tips
Trend + Structure + Volatility = edge.
Let zones act as your pre-defined decision map.
Use the HTF layer to validate or fade local setups.
Great in combination with:
Price action or liquidity maps
Volume profile / OBV
Oscillators for entry timing
✅ Summary
This indicator helps you:
Stay in trends longer with smart trailing logic.
Know exactly where volatility could expand or exhaust.
Align entries with multi-timeframe structure.
Visually separate trending from ranging conditions.
It's an educational idea, and it doesn’t predict the future — it frames it with objective volatility zones so you can trade with clarity and confidence.
Regards!

Initial Imbalance [First FVG - ICT] v1Initial Imbalance v1
This indicator identifies the first Fair Value Gap (FVG) at the start of a user-defined session, inspired by The Inner Circle Trader. It helps traders spot initial imbalance in a sessions price action, offering filter options to refine FVG detection and optional session high/low lines for context.
Features:
Detects the first bullish or bearish FVG at the session start (default: 08:30). ISE: Sets a custom session start time (hour and minute).
Filters FVGs by size: None, ATR-based, or Points-based.
Displays session high/low lines (optional) to visualize the session range.
Customizable colors for bullish and bearish FVGs (background and border derived from a single color input).
Alerts for new FVGs and mitigated FVGs.
Settings:
Session Start Time: Define the hour and minute for the session start.
FVG Filter Type: Choose None, ATR, or Points to filter FVGs by size.
ATR Multiple / Minimum Points: Set the minimum FVG size for ATR or Points filters.
Show Session High/Low Lines: Toggle visibility of session range lines.
Bullish/Bearish FVG Colors: Customize colors for FVGs.
Technical Details:
Overlay indicator, displayed directly on the price chart.
This indicator is ideal for traders seeking to identify key price imbalances at the start of a session, with flexible filtering and visualization options.
